EV Performance Metrics
Table of Contents
#
Intro
In the beginning of my EV journey, “range anxiety” was a serious concern, especially with fewer chargers in 2022 than there are now. The key is understanding efficiency. So, I ran a test in my MINI Cooper SE 2023.
The first drive, I tried being as efficient as possible while still going the speed limit. The second drive, I basically just followed traffic.
The weather was similar in both tests, but the roads in the less efficient test were a little wet.
#
Eco Drive
- Minimize and smooth current draw
- Maintain lower speeds (especially uphill)
- Regen brake early and ease into it on flat ground
- Accelerate without power and brake later downhill
#
Non-Eco Drive
- Follow traffic
- Don’t ease into braking
- Accelerate uphill
- Floor it at green lights
#
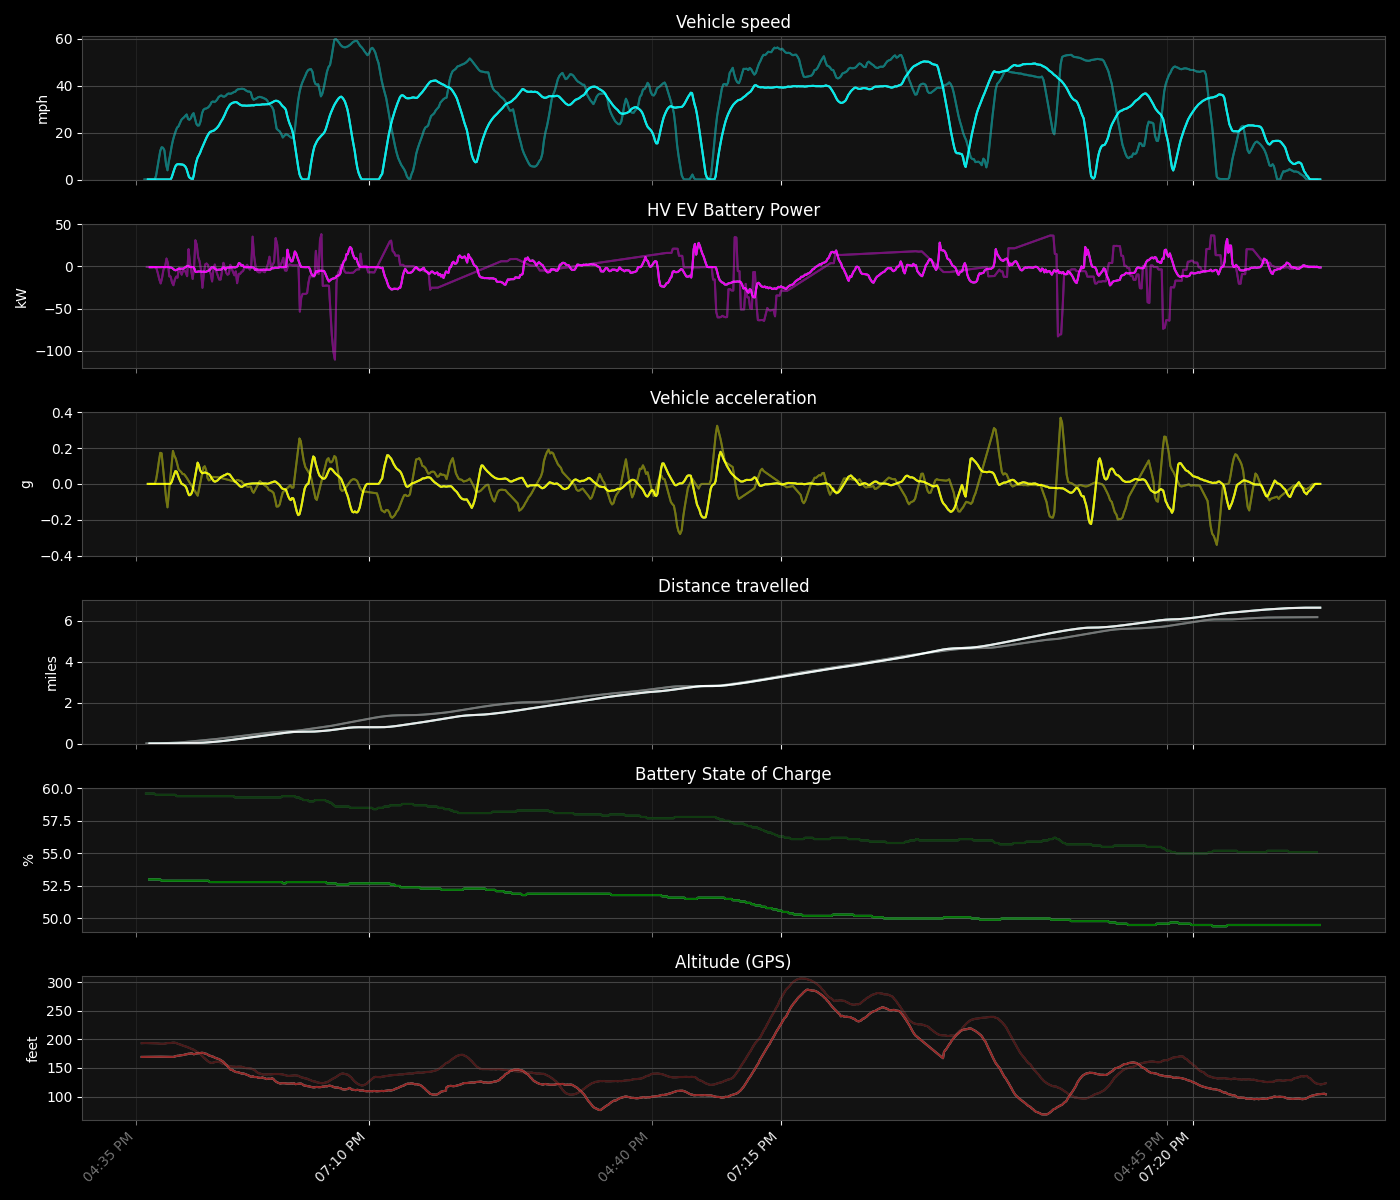
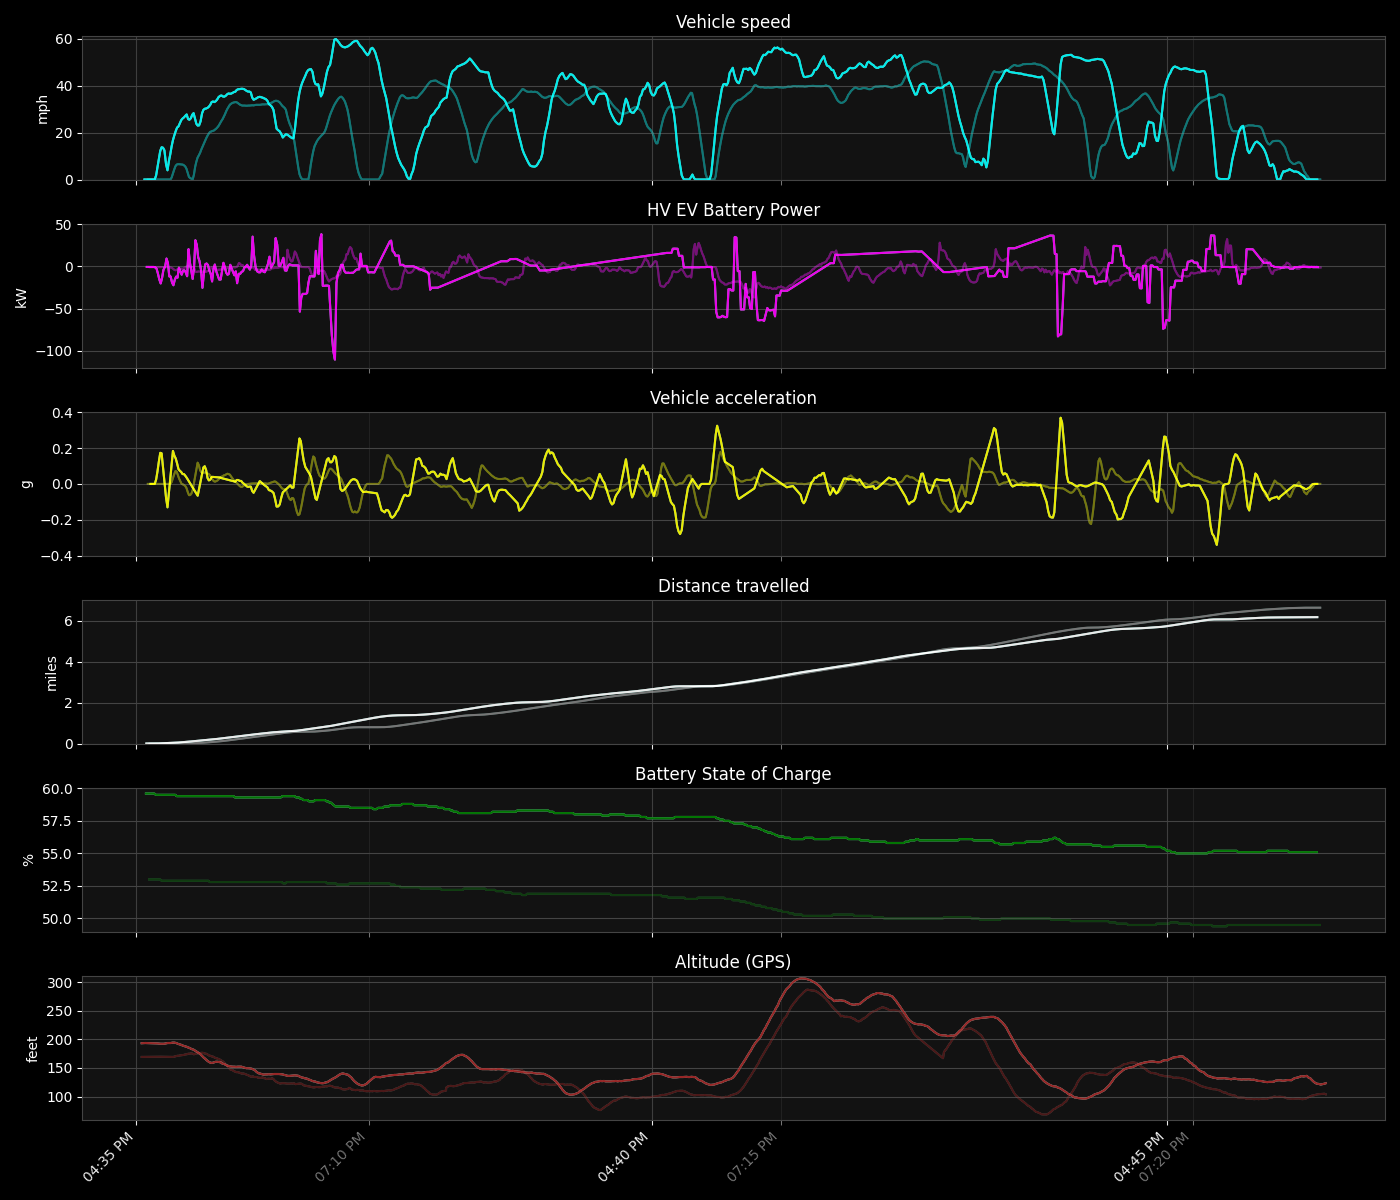
Overlapped Figures
##
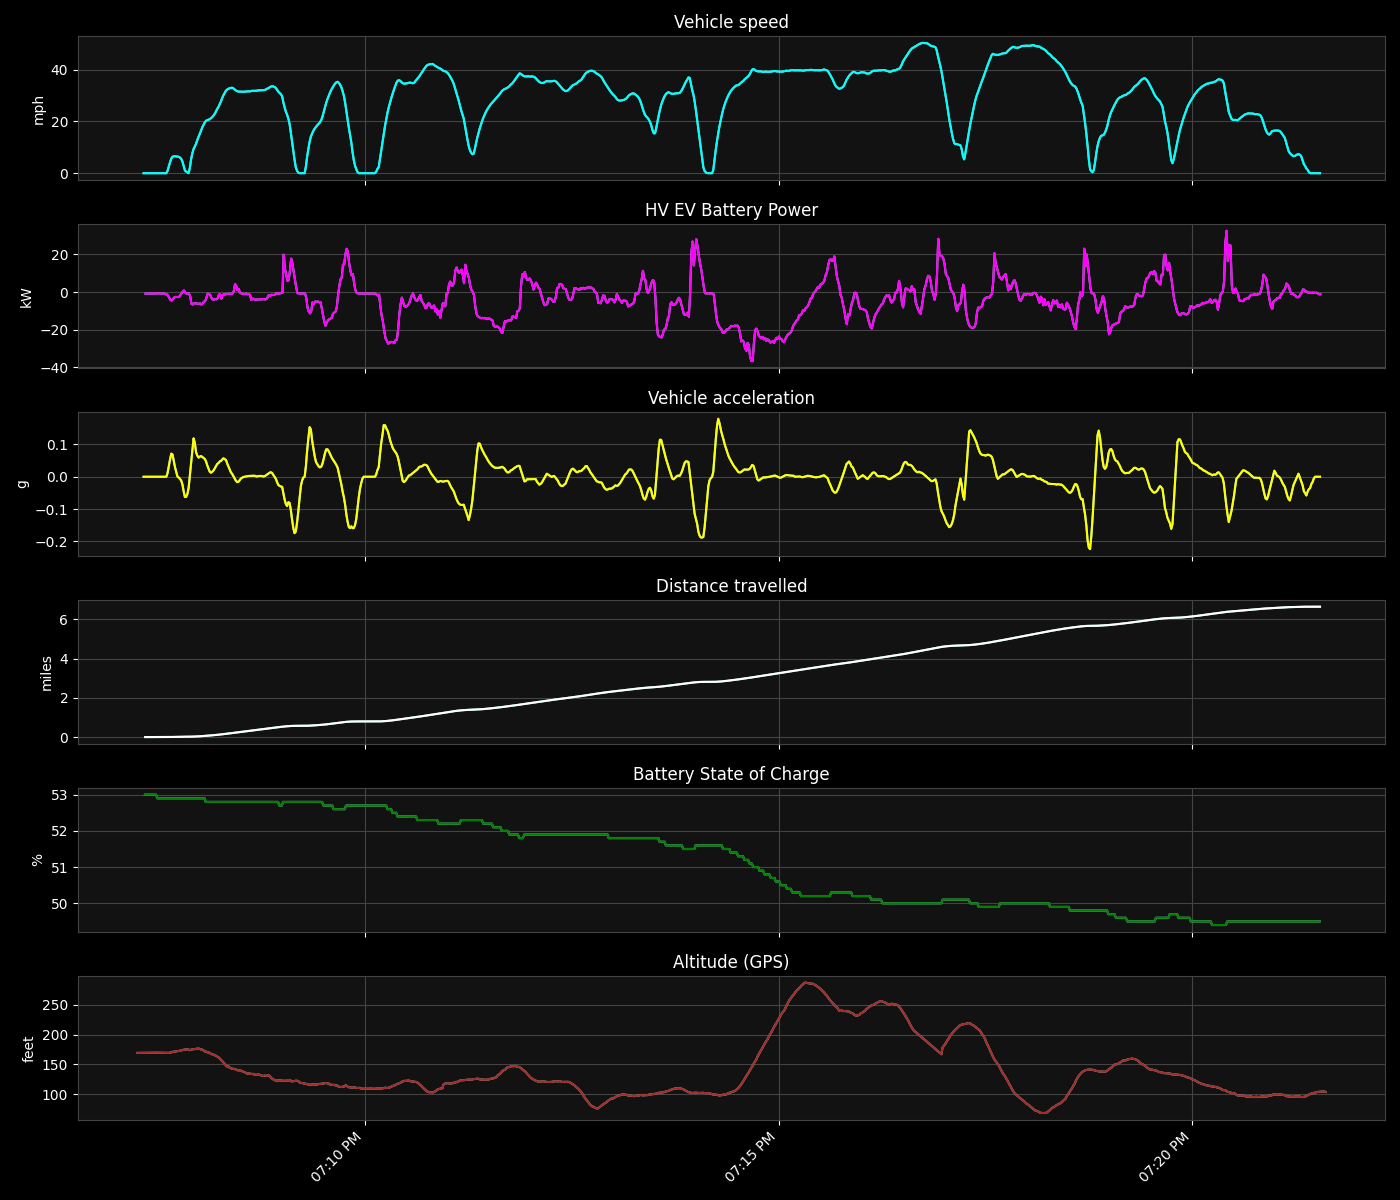
Eco Focused
Battery state of charge for eco driving is flatter, with less spikes. Vehicle speed was lower.
Eco driving:
53% to 49.5% = 3.5%
3.5% of 28.9 kWh = 1 kWh
6.6 miles per kWh
Non eco driving:
59.6% to 55.1% = 4.5%
4.5% of 28.9 kWh = 1.3 kWh
6.2 miles per 1.3 kWh = 4.8 miles per kWh
We gained 1% more of the total battery driving only 6 miles. We were 37.5% more efficient. That’s 52 more miles total on a full charge.
##
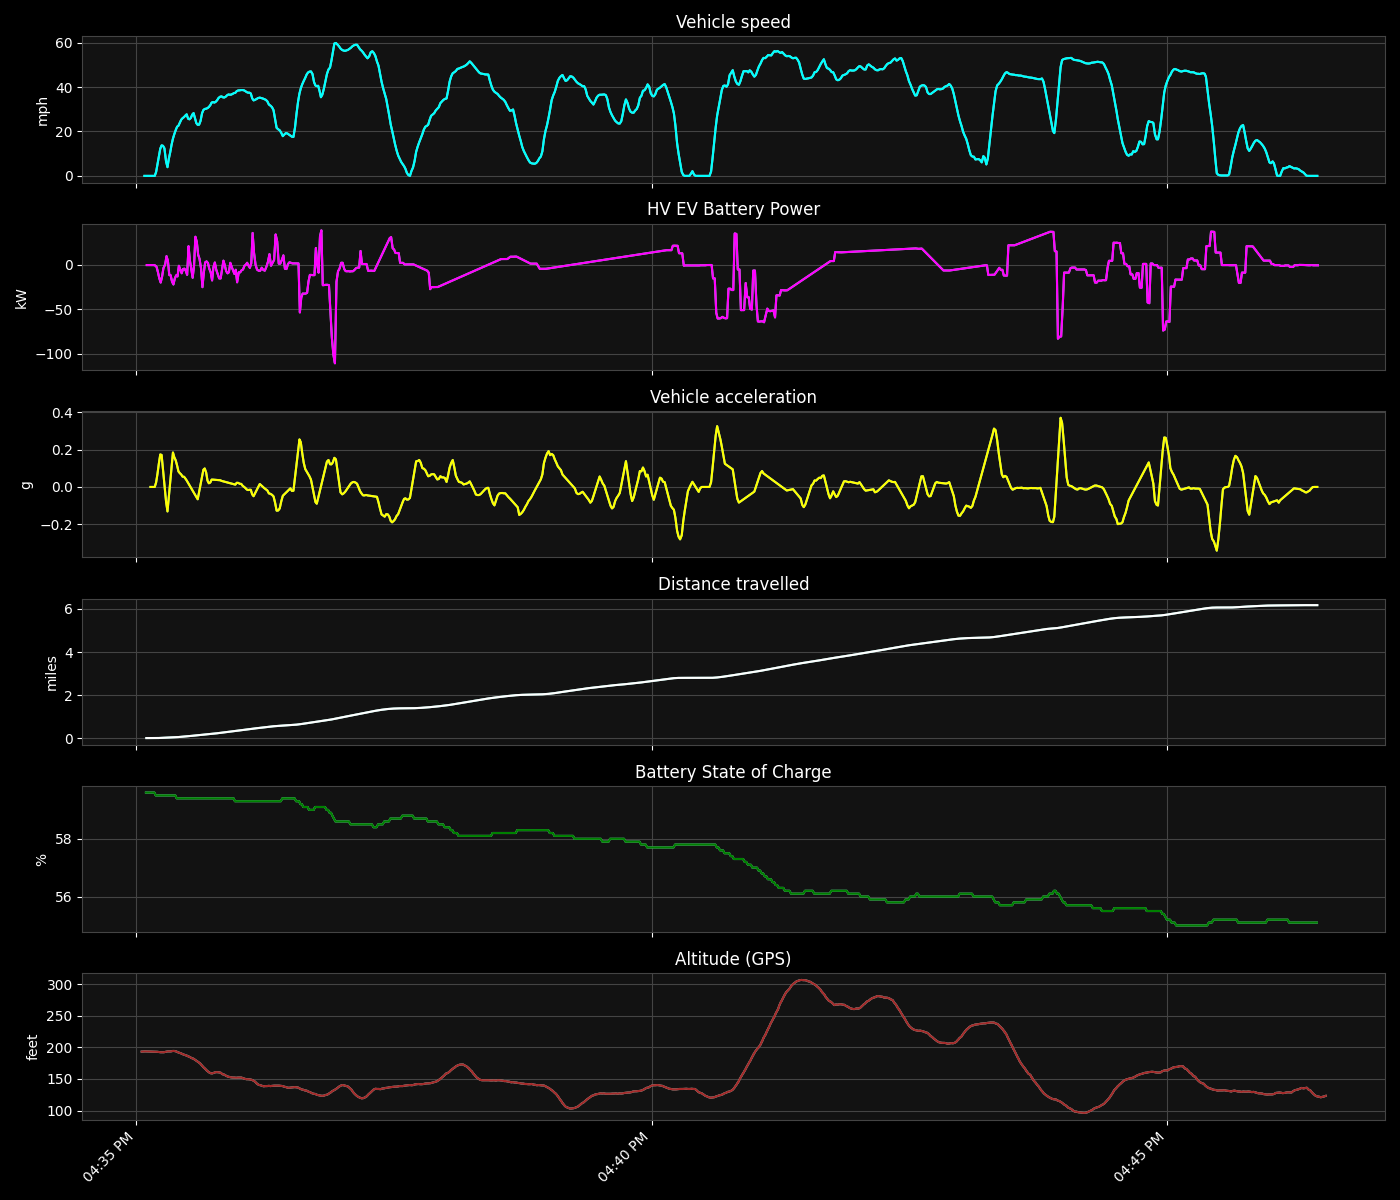
Non Eco Focused
Do you see the hill in the middle of the altitude graph? For this run, vehicle acceleration and battery power spiked on this hill.
#
How to Gather Efficiency Data
I used the Veepeak OBDCheck BLE+ and Car Scanner from the iOS App Store to record and export the data.
#
Source Code
Use this Python script to filter and format the data in a Matplotlib plot. Source code here.